2. What tools does DAVID provide to analyze my gene lists?
3. What accession numbers and gene identifiers does DAVID accept?
4. What file formats can be uploaded/downloaded by DAVID?
5. Who can use DAVID?
6. Where does DAVID's knowledgebase come from and how current is it?
7. Who do I contact if I find an annotation error?
8. How are genes counted in DAVID Chart Report?
9. Why are there different levels for GO Annotation?
10. What does it mean to have empty chart report?
11. How do I cite DAVID?
12. What is the purpose of the minimum number of hits and maximum p-value thresholds?
13. What journal articles have cited DAVID or EASE?
14. Not all of my genes are annotated! Why?
15. How can I use DAVID functional analysis modules programmatically?
16. What are the choices of population backgrounds in DAVID 2006?
17. Does DAVID limit the maximum number of genes in a list?
18. What is the format requirement to submit a gene list to DAVID?
19. Which DAVID tools is more suitable to answer my questions?
20. Why DAVID gives empty results after I walk away for a while?
DAVID was originally designed as a web-based functional annotation tool, particularly for gene-enrichment analysis on the DAVID knowledgebase which contained annotations and gene accessions linked by LocusLink IDs in the 2003 version (v1.x). As the result of continuous improvement, DAVID provides a large integrated annotation knowledgebase based on the "DAVID Gene Concept" since v2.x, a method to agglomerate heterogeneous and widely distributed public databases. Besides functional annotation, it also provides an enhanced set of bioinformatics tools to summarize the relevant biological patterns for users to quickly understand the biological themes under study. To address the challenges of systems biology, DAVID will keep being upgraded and more tools will be developed.
2. What tools does DAVID provide to analyze my gene list?
DAVID provides an integrated knowledgebase collected from the most common bioinformatic resources (see update of knowledgebase for details). To leverage the knowledgebase, four sets of comprehensive tools have been developed including: Functional Annotation Tools; Gene Functional Classification Tool; Gene ID Conversion Tool; Gene Name Batch Viewer. With the Functional Annotation Tools, users can perform functional annotation mapping (Functional Annotation Table), functional annotation enrichment analysis (Functional Annotation Chart), and functional annotation clustering based on the relationship of genes to annotation within the user's list (Functional Annotation Clustering). The Gene Functional Classification Tool generates a gene-to-gene similarity matrix of the genes in the user's list based on shared functional annotation from multiple functional annotation categories. This novel clustering algorithm classifies highly related genes into functionally related groups. With the Gene ID Conversion Tool, users can convert a list of gene IDs/accessions to other identifier types with the comprehensive gene ID mapping repository from the DAVID Knowledgebase. The ambiguous or contaminating accessions in a user's list can also be detected and determined by users with this tool. The Gene Name Batch viewer is able to quickly list all gene names for a given gene list to quickly view the genes which are present in a user's experiment.
3. What accession numbers and gene identifiers does DAVID accept?
DAVID accepts a wide range of gene/protein identifiers. Users can view all the identifier options from the drop-down selection menu in Upload tab of the List Manager on the left side of the user interface.
4. What file formats can be uploaded/downloaded by DAVID?
Plain text (*.txt), tab-delimited files can be uploaded by DAVID. For the single gene list, the first column of your file must contain the gene identifier and the second column may contain an optional value (e.g., fold change, p-value, correlation, cluster number, experimental group, etc.). Remove column headings and save the file as a Tab delimited text file. To convert an excel file to this format choose File>Save As> then under save as type choose Text (Tab delimited) (*.txt). To save your annotated gene list from your browser to your hard drive as an excel file simply choose File>Save As> then type yourfilename.xlsx and save to your hard drive. You can then open this file in Microsoft excel and perform typical excel-type analysis. User can also upload multiple gene lists at once from one file. The file format is tab-delimited text file, with each column representing one list. The first row (header) should contain the names of the individual lists and all lists should be of the same id type (i.e. ENTREZ_GENE_ID).
DAVID is free to use for all users. Please see the license section for more details.
6. Where does DAVID's knowledgebase come from and how current is it?
The DAVID
knowledgebase agglomerates species-specific gene/protein identifiers and their
annotations from a variety of public genomic resources (e.g. NCBI, Uniprot, Ensembl,
Gene Ontology, KEGG, Reactome, etc.). The DAVID Knowledgebase contains tens of millions
of identifiers from tens of thousands of species allowing agglomeration of a
diverse array of functional and sequence annotation, greatly enriching the
level of biological information available for a given gene (e.g. gene/protein ids,
protein functional domains, gene ontology, pathways, disease associations, general
descriptions, protein-protein interactions, literature, small molecule interactions,
etc.). However, DAVID does not check the quality or accuracy of all original
annotation data. If you happen to find annotation errors, please give us your
feedback in the DAVID
forum or contact us. For more details on
content coverage and collection dates, including the last update, please refer
to the update section.
7. Who do I contact if I find an annotation error?
DAVID tries to aggregate biological knowledge into an organized structure that allows the efficient dissemination of functional annotations across genome-scale datasets. DAVID does not guarantee the quality or accuracy of annotation data. If you happen to find annotation errors, please give us your feedback in the DAVID forum or contact us.
8. How are genes counted in DAVID Chart Report?
DAVID counts the number of unique DAVID gene Ids corresponding to the input gene list. If two or more identifiers represent alternatively spliced forms of the same gene they will be counted as one and reflected as such in the histograms.
9. Why are there different levels for GO Annotation?
The structured vocabulary created by the Gene Ontology Consortium is a pseudo-hierarchy or directed acyclic graph (DAG). The different levels provided by DAVID allows users to annotate lists of genes at different levels within the DAG. Level 1 represents the most general categories and provides the most coverage, whereas Level 5 provides more specific information and less coverage. Users may also annotate their gene lists with all annotations available at all levels and for some genes there will be more than 5 levels. Additionally, users can choose to use only a subset of the more specific terms represented by the GO_Fat categories. The GO level specific, All and Fat categories provide GO annotations based on the data provided by the original source (NCBI, Uniprot and Ensembl) and DAVID additionally maps the gene to the lineage of the directly annotated term (i.e. parents, grandparents, etc.). GO terms annotated directly by the annotation source are represented by the GO_Direct categories which are the GO categories selected by default in DAVID. Of note, the fact that proteins are frequently involved in numerous biological processes is reflected in the Gene Ontology structure. Thus, genes may be annotated with several categories and be counted in each annotation category by the charting tools.
10. What does it mean to have empty chart report?
An empty chart report means that there are no annotations passing the specified thresholds. It does not mean that annotation does not exist for any of the genes in the list. Options can be adjusted at the top of the Chart report result page. By dropping the Count and EASE thresholds to 1, any annotation in the selected categories associated with any gene in the list and in the background will be in the results.
DAVID users may publish or otherwise publicly disclose the results obtained from DAVID. Please acknowledge DAVID in your publications by citing the following two references:
- Huang DW, Sherman BT, Lempicki RA. Systematic and integrative analysis of large gene lists using DAVID Bioinformatics Resources. Nature Protoc. 2009;4(1):44-57. [PubMed]
- Huang DW, Sherman BT, Lempicki RA. Bioinformatics enrichment tools: paths toward the comprehensive functional analysis of large gene lists. Nucleic Acids Res. 2009;37(1):1-13. [PubMed
12. What is the purpose of the minimum number of hits and maximum p-value thresholds?
One way of looking at it is that the thresholds allow you to filter the result, i.e. Show me annotations with 3 or more genes that are enriched in my list (significant p-value). If you show all categories including those with only one hit, a lot of non-specific results will be displayed. The current defaults for minimum number of hits (Count) is 2 and for p-value (EASE) is 0.1 which may be adjusted in the options found at the top of the Chart report result page.
13. What journal articles have cited DAVID or EASE?
Please refer to the DAVID Google Scholar page.
14. Not all of my genes are annotated! Why?
The reason for this is that the functional annotation of genomes is incomplete and the types of annotation that any given gene may have can differ. For example, when using DAVID, you may find a gene that has GO classifications and no functional summary text, while another gene has functional summary text and no GO classifications, and still others will have no annotation whatsoever. This is why the database behind DAVID is continually updated, giving researchers access to the current state of functional annotation, which indeed is always changing. Another reason is that some user input identifiers cannot be mapped to any known genes in the DAVID Knowledgebase. One other consideration is to make sure that the genes in your list are found in the background set that you have selected in DAVID otherwise, DAVID will ignore them.
15. How can I use DAVID functional analysis modules programmatically?
DAVID
provides a set of APIs and web services for outside applications to
directly interact with DAVID.
16. What are the choices of population background in DAVID enrichment analysis?
The
enrichment analysis compares the annotation composition based on your gene list
to that of a background population of genes. In this sense, the selection of a background
population will affect the results significantly. The DAVID default background is
the set of corresponding genome-wide genes for the species with the highest
representation in the user's list. The default background is a good choice for studies
in a genome-wide scope or close to genome-wide scope. More background choices are
available in DAVID, including Affymetrix and Illumina array backgrounds. The
pre-built Affymetrix and Illumina backgrounds can be selected through the
"Background" tab of the Gene List Manager on the left side of the
interface. Affymetrix and Illumina backgrounds will be a better choice for a
gene list derived from Affymetrix microarray or Illumina studies, respectively.
Users may also input a customized background by uploading in the List Manager
on the left side of the interface, similar to submitting a gene list.
Customized backgrounds will be a better choice for studies far below a genome-wide
scope, such as targeted gene experiments.
17. Does DAVID limit the maximum number of genes in a list?
The goal of DAVID's design is to be able to efficiently upload and
analyze a list consisting of <=3000 genes. All DAVID tools have been tested
with lists in this range and should return results in a few seconds to no more
than a few minutes. If running time is longer than a few minutes, please
contact the DAVID Bioinformatic Team
for help. Please note that Functional Annotation Clustering and Gene Functional
Classification have a 3000 gene limit.
18. What is the format requirement for my input gene list?
You can either load a gene list from a file or paste a gene list
to the text box. DAVID was designed to accept the data starting from the first
row without header (i.e. accession). The gene list must be in a format of one
gene in one row and only the first column is considered in the analysis. DAVID
is case insensitive for the accessions/IDs. Since the DAVID list manager is centralized,
the format requirement to submit a gene list are the same for ALL DAVID tools.
In addition, the submitted gene lists could be used as customized background
genes in the enrichment analysis based on your choice at step 3. The indication
of a successful submission is that you should see the corresponding gene lists
listed by list tab or background tab. Moreover, an expected gene # should also be
associated with the gene lists.
Example:
1000_at
1001_at
1002_at
In addition, DAVID has links for two pre-built Demo_lists for
users who do not have a gene list and would like to explore DAVID. You just
simply click on the links for Demolist 1 or Demolist 2 on top of the submission
box to start the analysis. Following is the information regarding the two Demo lists:
Demo List 1: One hundred sixty-four genes found to be upregulated in CD4+/CD62L- T cells relative to CD4+/CD62L+ T cells.
Cutting edge: L-selectin (CD62L) expression distinguishes small
resting memory CD4+ T cells that preferentially respond to recall antigen.
Hengel RL, Thaker V, Pavlick MV, Metcalf JA, Dennis G Jr, Yang J,
Lempicki RA, Sereti I, Lane HC. J Immunol 2003 Jan 1;170(1):28-32.
Naive CD4+ T cells use L-selectin (CD62L) expression to facilitate
immune surveillance. However, the reasons for its expression on a subset of
memory CD4+ T cells are unknown. We show that memory CD4+ T cells expressing
CD62L were smaller, proliferated well in response to tetanus toxoid, had longer
telomeres, and expressed genes and proteins consistent with immune surveillance
function. Conversely, memory CD4+ T cells lacking CD62L expression were larger,
proliferated poorly in response to tetanus toxoid, had shorter telomeres, and
expressed genes and proteins consistent with effector function. These findings
suggest that CD62L expression facilitates immune surveillance by programming
CD4+ T cell blood and lymph node recirculation, irrespective of naive or memory
CD4+ T cell phenotype.
Demo List 2: Four hundred three genes found to be induced in peripheral blood mononuclear cells incubated with purified HIV envelope proteins.
HIV envelope induces a cascade of cell signals in non-proliferating target cells that favor virus replication.
Cicala C, Arthos J, Selig SM, Dennis G Jr, Hosack DA, Van Ryk D,
Spangler ML, Steenbeke TD, Khazanie P, Gupta N, Yang J, Daucher M, Lempicki RA,
Fauci AS. Proc Natl Acad Sci U S A 2002 Jul 9;99(14):9380-5
Certain HIV-encoded proteins modify host-cell gene expression in a
manner that facilitates viral replication. These activities may contribute to
low-level viral replication in nonproliferating cells. Through the use of
oligonucleotide microarrays and high-throughput Western blotting we demonstrate
that one of these proteins, gp120, induces the expression of cytokines,
chemokines, kinases, and transcription factors associated with antigen-specific
T cell activation in the absence of cellular proliferation. Examination of
transcriptional changes induced by gp120 in freshly isolated peripheral blood
mononuclear cells and monocyte-derived-macrophages reveals a broad and complex
transcriptional program conducive to productive infection with HIV.
Observations include the induction of nuclear factor of activated T cells,
components of the RNA polymerase II complex including TFII D, proteins
localized to the plasma membrane, including several syntaxins, and members of
the Rho protein family, including Cdc 42. These observations provide evidence
that envelope-mediated signaling contributes to the productive infection of HIV
in suboptimally activated T cells.
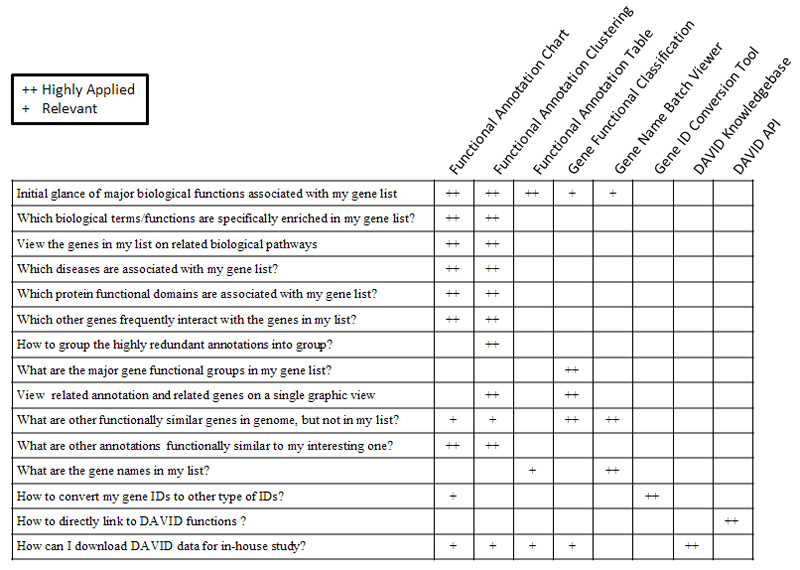
19. Which DAVID tools to choose?
The following table may help you make your decisions.
20. Why does DAVID give empty results after I walk away for awhile?
The session timeout of DAVID is set to 30 minutes. In other words, if your web browser has no activity with DAVID for 30 minutes, your session will end, and you will need to re-submit your gene list to DAVID and restart your analysis.
Last edited December 10, 2020